

Growth in deposits continue to drive loan growth
Strong operating performance
Well capitalised with adequate liquidity buffers
Retail book is well diversified, largely secured with high share of ETB & salaried customers
Strong Relationship led Wholesale Franchise
Asset Quality
Snapshot (As on March 31st, 2020) (in ` Crores)
| Profit & Loss | Absolute (in ` Crs) | YOY Growth | ||
|---|---|---|---|---|
| Q4FY20 | FY20 | Q4FY20 | FY20 | |
| Net Interest Income | 6,808 | 25,206 | 19% | 16% |
| Fee Income | 2,931 | 11,019 | (3%) | 9% |
| Operating Expenses | 4,942 | 17,305 | 17% | 9% |
| Operating Profit | 5,851 | 23,438 | 17% | 23% |
| Profit Before Tax | (1,879) | 4,904 | - | (30%) |
| Net Profit / (Loss) | (1,388) | 1,627 | - | (65%) |
| Balance Sheet | Absolute (in ` Crs) | YOY Growth | ||
|---|---|---|---|---|
| FY20 | ||||
| Total Assets | 915,165 | 14% | ||
| Net Advances | 571,424 | 15% | ||
| Total Deposits | 640,105 | 17% | ||
| Shareholders' Funds | 84,948 | 27% | ||
| Key Ratios | Absolute (in ` Crs) | YOY Growth |
|---|---|---|
| FY20 | FY19 | |
| Diluted EPS* (in `) (Q4/12M) | (19.79) / 5.97 | 23.61 /18.09 |
| Book Value per share (in `) | 301 | 259 |
| ROA (in %) (Q4*/12M) | (0.62) / 0.2 | 0.78 / 0.63 |
| ROE (in %) (Q4*/12M) | (7.08) / 2.34 | 10.30 / 8.09 |
| Gross NPA Ratio | 4.86% | 5.26% |
| Net NPA Ratio | 1.56% | 2.06% |
| Basel III Tier I CAR | 14.49% | 12.54% |
| Basel III Total CAR | 17.53% | 15.84% |
* Annualised
 19% YOY
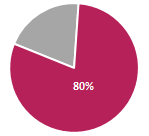
 CASA+RTD#
#QAB - Quarterly Average Balance
15% YOY 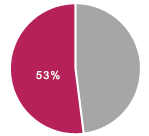 Retail Advances**
** As proportion of Total Advances

* PAT adjusted for one-time DTA impact, lower tax rate and prudent Covid risk provisioning would be `5,182 crores
Strong operating performance:
Growth in Deposits continues to drive Loan growth:
Well capitalized with adequate liquidity buffers:
Business segments' performance:
Asset quality metrics improving, additional provisions held of `5,983 crores:
Among the top players in the digital space:
* PCR excluding technical write-offs