

Steady Operating performance
Healthy growth in Loan book
Steady growth in Deposit franchise
Retail business momentum remains strong
Asset quality stable at elevated levels
Snapshot (As on Dec 31st, 2019) (in ` Crores)
| Profit & Loss | Absolute (in ` Crs) | YOY Growth | ||
|---|---|---|---|---|
| Q3FY20 | 9MFY20 | Q3FY20 | 9MFY20 | |
| Net Interest Income | 6,453 | 18,398 | 15% | 15% |
| Fee Income | 2,775 | 8,087 | 6% | 14% |
| Operating Expenses | 4,497 | 12,363 | 10% | 6% |
| Operating Profit | 5,743 | 17,587 | 4% | 26% |
| Profit Before Tax | 2,272 | 6,783 | (8)% | 45% |
| Net Profit / (Loss) | 1,757 | 3,015 | 5% | (5)% |
| Balance Sheet | Absolute (in ` Crs) | YOY Growth | ||
|---|---|---|---|---|
| Q3FY20 | ||||
| Total Assets | 819,039 | 8% | ||
| Net Advances | 550,138 | 16% | ||
| Total Deposits | 591,676 | 15% | ||
| Shareholders' Funds | 86,198 | 29% | ||
| Key Ratios | Absolute (in ` Crs) | YOY Growth |
|---|---|---|
| Q3FY20 | Q3FY19 | |
| Diluted EPS* (in `) (Q3/9M) | 24.71 / 14.91 | 25.86 / 16.33 |
| Book Value per share (in `) | 306 | 260 |
| ROA* (in %) (Q3/9M) | 0.86 / 0.50 | 0.88 / 0.57 |
| ROE* (in %) (Q3/9M) | 8.83 / 5.86 | 11.33 / 7.25 |
| Gross NPA Ratio | 5.00% | 5.75% |
| Net NPA Ratio | 2.09% | 2.36% |
| Basel III Tier I CAR1 | 15.54% | 13.07% |
| Basel III Total CAR1 | 18.72% | 16.40% |
* Annualised
1 including profit for 9MFY20
 21% YOY
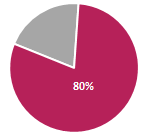
 CASA+RTD#
#QAB - Quarterly Average Balance
18% YOY 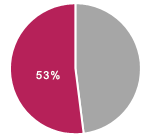 Retail Advances**
** As proportion of Total Advances
$ Includes one off large recovery of `800 crores in written off accounts, witnessed in Q3FY19
* Growth after adjusting for one off large recovery of `800 crores in Q3FY19
Steady financial performance:
Operating Profit for Q3FY20 stood at `5,743 crores. Adjusted for a previously disclosed one-off recovery of `800 crore in Q3FY19, Operating Profit grew 22% YOY, Asset quality metrics largely stable:
Loan book growth remains healthy:
Deposit franchise had a steady quarter:
Retail business momentum remains strong:
Among the top players in the digital space:
The Bank’s Capital Adequacy Ratio (CAR) remains strong: