
Strong capital position with adequate liquidity buffers
Balanced performance across business segments
Healthy growth in deposits continue to drive loan growth
Steady operating performance
Asset Quality
* During Q1FY21 quarter, we have reviewed our accounting practices and revised them to achieve more prudent outcomes. The broad areas where changes were implemented in the current quarter were (i) Fee and expense recognition; (ii) Provisions on Standard Investments and red flagged accounts

Snapshot (As on June 30th, 2020) (in ` Crores)
| Profit & Loss | Q1FY21 | YOY Growth |
|---|---|---|
| Net Interest Income | 6,985 | 20% |
| Fee Income | 1,651 | (38%) |
| Operating Expenses | 3,728 | (2%) |
| Operating Profit | 5,844 | (1%) |
| Net Profit | 1,112 | (19%) |
| Balance Sheet | Q1FY21 | YOY Growth |
|---|---|---|
| Total Assets | 897138 | 16% |
| Net Advances | 561,341 | 13% |
| Total Deposits | 628,150 | 16% |
| Shareholders' Funds | 86,071 | 21% |
| Key Ratios | Q1FY21 | Q1FY20 |
|---|---|---|
| Diluted EPS* (in `) | 15.79 | 21.14 |
| Book Value per share (in `) | 305 | 272 |
| ROA* | 0.48% | 0.69% |
| ROE* | 5.74% | 9.19% |
| Gross NPA Ratio | 4.72% | 5.25% |
| Net NPA Ratio | 1.23% | 2.04% |
| Basel III Tier I CAR1 | 14.62% | 12.90% |
| Basel III Total CAR1 | 17.47% | 16.06% |
* Annualised
1 including profit for Q1
 19% YOY
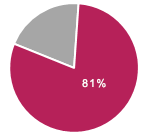
 CASA+RTD#
#QAB - Quarterly Average Balance
12% YOY 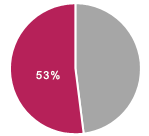 Retail Advances**
** As proportion of Total Advances
 1% YOY
* Adjusted for accounting policy changes and NII reserves created, the operating profit would have been `6,151 crores, up 4% and PAT would have been been `1,626 crores, up 19%
19% YOY

Steady operating performance, net profit (1) up 19% YOY:
Growth in Deposits continues to drive Loan growth:
Strong Capital position with adequate liquidity buffers:
Sustained and continuous strengthening and de-risking of Balance Sheet, visible through improving Asset quality metrics, consistent build-up of additional provisions:
Among the top players in the digital space:
1 Like for like comparison
* PCR excluding technical write-offs