
Steady performance for the quarter, incorporating the impact of income de-recognition and provisions per IRAC norms and prudent accounting practices towards further strengthening of balance sheet
Steady growth in stable and granular retail deposits continues to aid loan growth
Robust operating performance
Balanced performance across business segments
Maintain leadership position in Digital
Well capitalized with adequate liquidity buffers
Strengthening and derisking of Balance Sheet
Our key subsidiaries have delivered strong performance
QAB: Quarterly Average Balance
* Operating profit excluding trading profit and exchange gain on capital repatriated from overseas branch
Coverage Ratio = Aggregate provisions (specific + standard + additional + COVID) / IRAC GNPA
Standard Assets Coverage Ratio (SACR) = Standard asset provisions plus additional provisions plus COVID provision / Standard loans

Snapshot (As on December 31st, 2020) (in ` Crores)
| Profit & Loss | Absolute (in ` Crores) | YOY Growth | ||
|---|---|---|---|---|
| Q3FY21 | 9MFY21 | Q3FY21 | 9MFY21 | |
| Net Interest Income | 7,373 | 21,684 | 14% | 18% |
| Fee Income | 2,906 | 7,310 | 5% | (10%) |
| Operating Expenses | 5,053 | 13,017 | 12% | 5% |
| Operating Profit | 6,096 | 18,838 | 6% | 7% |
| Net Profit | 1,117* | 3,911 | (36%) | 30% |
* Net of impact of prudent choices ~ `1,050 crs
| Balance Sheet | Absolute (in ` Crores) | YOY Growth |
|---|---|---|
| Q3FY21 | ||
| Total Assets | 938,049 | 15% |
| Net Advances | 582,754 | 6% |
| Total Deposits^ | 654,140 | 11% |
| Shareholders' Funds | 98,817 | 15% |
^ period end balances
| Key Ratios | Absolute (in ` Crores) | |
|---|---|---|
| Q3FY21 / 9MFY21 | Q3FY20 / 9MFY20 | |
| Diluted EPS* (in `) (Q3/9M) | 14.47 / 17.61 | 24.71 / 14.91 |
| Book Value per share (in `) | 323 | 306 |
| ROA* (in %) (Q3/9M) | 0.48 / 0.56 | 0.86 / 0.50 |
| ROE* (in %) (Q3/9M) | 4.91 / 6.13 | 8.83 / 5.86 |
| Gross NPA Ratio | 3.44% | 5.00% |
| Net NPA Ratio | 0.74% | 2.09% |
| Basel III Tier I CAR1 | 16.48% | 15.54% |
| Basel III Total CAR1 | 19.31% | 18.72% |
* Annualised
1 including profit for 9M
 11% YOY
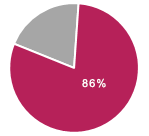
 CASA+RTD
#QAB - Quarterly Average Balance
9% YOY 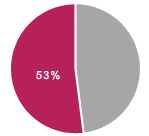 Retail Advances
6% YOY
 36% YOY

Robust operating performance, Net Interest Income (NII) grew 14% YOY:
Steady growth in stable and granular retail deposits:
Well capitalized with adequate liquidity buffers:
Balanced performance across business segments:
Retain leadership position in Digital:
Strengthening and de-risking of balance sheet, visible through improving asset quality metrics:
Bank's domestic subsidiaries delivered strong results with reported total PAT exceeding FY20 profits$ :
* Excluding trading profit and gain / loss on capital repatriated from overseas branch
^ Targeted long term repo operations
$ Figures of subsidiaries are as per Indian GAAP, as used for consolidated financial statements of the Group
1 QAB – Quarterly Average Balance
2 LCR – Liquidity Coverage Ratio
3 NNPA% stated on (reported basis) / (per IRAC norms)
4 PCR% stated on (reported basis) / (per IRAC norms)