
Strong core operating performance and margin expansion, sequential PAT growth, healthy growth in average deposits and loans
Q1 FY23 Consolidated ROE (annualized) at 15.66% with subsidiaries contributing 59 bps, up 587 bps YOY
1. SBB : Small Business Banking
2. Coverage Ratio = Aggregate provisions (specific + standard + additional +
Covid) / IRAC GNPA
QAB: Quarterly Average Balance
* : Based on RBI data from
Mar’22 to May’22

Snapshot (As on June 30th, 2022) (in ` Crores)
| Profit & Loss | Absolute (in ` Crores) | YOY Growth |
|---|---|---|
| Q1FY23 | ||
| Net Interest Income | 9,384 | 21% |
| Fee Income | 3,576 | 34% |
| Operating Expenses | 6,496 | 32% |
| Operating Profit | 5,887 | (5%) |
| Net Profit | 4,125 | 91% |
| Balance Sheet | Absolute (in ` Crores) | YOY Growth |
|---|---|---|
| Q1FY23 | ||
| Total Assets | 11,52,580 | 14% |
| Net Advances | 7,01,130 | 14% |
| Total Deposits^ | 8,03,572 | 13% |
| Shareholders' Funds | 1,19,378 | 15% |
^ period end balances
| Key Ratios | Absolute (in ` Crores) | |
|---|---|---|
| Q1FY23 | Q1FY22 | |
| Diluted EPS (Annualised in `) | 53.76 | 28.19 |
| Book Value per share (in `) | 389 | 339 |
| ROA (Annualised) | 1.44% | 0.86% |
| ROE (Annualised) | 15.07% | 9.11% |
| Gross NPA Ratio | 2.76% | 3.85% |
| Net NPA Ratio | 0.64% | 1.20% |
| Basel III Tier I CAR* | 15.79% | 16.48% |
| Basel III Total CAR* | 17.83% | 19.01% |
* including profit for the quarter
 14% YOY
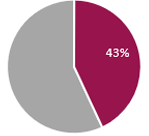
 CASA#
CASA#
16% YOY
(QAB#) | 14% YOY (End
Balance)
#QAB - Quarterly Average Balance
14% YOY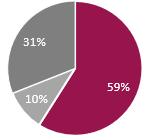 Retail
 SME
SME
 Corporate
25% YOY
|
27% YOY |
 5% YOY
17% YOY 91% YOY


Strong core operating performance, net profit grew sequentially to `4,125 crores, up 91% YOY
Loan growth delivered across focused business segments
Healthy growth in granular deposits
Retaining strong position in Payments and Digital Banking
Well capitalized with adequate liquidity buffers
Declining gross slippages and NPA's, moderating credit costs, low restructured book
Bank's domestic subsidiaries continue to deliver robust performance; annualized profit4 at `1,082 crores
** ratings on Google Play & Apple App stores
1 QAB – Quarterly Average Balance
2 Statutory Liquidity ratio
3 (specific+ standard+ additional + Covid)
4 Figures of subsidiaries are as per Indian GAAP, as used for consolidated
financial statements of the Group