


1QAB: Quarterly Average Balance, MEB: Month End Balance
2Bank’s focus segments include Small Business Banking (SBB), Small & Medium
Enterprises, (SME), Mid Corporate, Rural, Personal Loans (PL) and Credit Card Advances
3 SBB : Small Business Banking;
4 Market share for Q2Y26;
5 NPCI data for top 50 UPI Remitter Members, last 12 months average as of
Aug’25;
6 Based on RBI data as of Aug’25;
7 MAU: Monthly Active Users engaging in financial & non-financial transactions;
8 Coverage Ratio = Aggregate provisions (specific + standard + additional + other contingencies)
/ IRAC GNPA

Snapshot (As on September 30th, 2025) (in ` Crores)
| Profit & Loss | Absolute (in ` Crores) | QOQ | YOY Growth | |||
|---|---|---|---|---|---|---|
| Q2FY26 | Q1FY26 | H1FY26 | Q2FY26 | Q2FY26 | H1FY26 | |
| Net Interest Income | 13,745 | 13,560 | 27,304 | 1% | 2% | 1% |
| Fee Income | 6,037 | 5,746 | 11,783 | 5% | 10% | 10% |
| Operating Expenses | 9,957 | 9,303 | 19,259 | 7% | 5% | 3% |
| Operating Profit | 10,413 | 11,515 | 21,928 | (10%) | (3%) | 5% |
| Core Operating Profit | 9,915 | 10,095 | 20,010 | (2%) | 3% | 4% |
| Profit after Tax | 5,090 | 5,806 | 10,896 | (12%) | (26%) | (16%) |
| Balance Sheet | Absolute (in ` Crores) | YOY Growth |
|---|---|---|
| Q2FY26 | ||
| Total Assets | 16,76,614 | 11% |
| Net Advances | 11,16,703 | 12% |
| Total Deposits | 12,03,487 | 11% |
| Shareholders' Funds | 1,89,947 | 15% |
| Key Ratios | Absolute (in ` Crores) | |
|---|---|---|
| Q2FY26 / H1FY26 | Q2FY25 / H1FY25 | |
| Diluted EPS (Annualised in `)(Q2/H1) | 64.75 / 69.70 | 88.20 / 83.04 |
| Book Value per share (in `) | 612 | 532 |
| Standalone ROA (Annualised %) | 1.23 / 1.35 | 1.84 / 1.75 |
| Standalone ROE (Annualised %) | 11.06 / 12.09 | 17.58 / 16.97 |
| Cons ROA (Annualised %) | 1.30 / 1.39 | 1.92 / 1.80 |
| Cons ROE (Annualised %) | 11.51 / 12.53 | 18.08 / 17.43 |
| Gross NPA Ratio | 1.46% | 1.44% |
| Net NPA Ratio | 0.44% | 0.34% |
| Basel III Tier I CAR^ | 14.83% | 14.54% |
| Basel III Total CAR^ | 16.55% | 16.61% |
^ including profit after tax for H1
 11% YOY (a) 10% YOY (b)
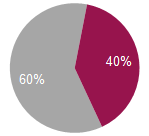
 CASA (a)
9% YOY (a) | 5% YOY (b)
(a) Period end balances (b) Quarterly average balance
12% YOY 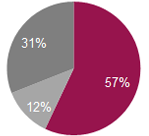 Retail
 SME
SME
 Corporate
6% YOY | 19% YOY | 20% YOY
 3% YOY 26% YOY

Steady operating performance aided by stable NII and robust fee income

Gained market share on MEB deposits, Focus on average deposits continues
Gained market share on advances, granular book continues to grow steadily
Well capitalized with adequate liquidity buffers
Continue to maintain our strong position in Payments and Digital Banking
Stable asset quality
Key domestic subsidiaries11 delivered steady performance
1MEB: Month End Balance, QAB: Quarterly Average Balance
2Liquidity Coverage Ratio;
3 SBB : Small Business Banking;
4 Bank’s focus segments include Small Business Banking (SBB), Small & Medium Enterprises, (SME), Mid Corporate, Rural, Personal Loans (PL) and Credit Card Advances;
5 not included in CAR calculation;
6 with 3.2mn+ reviews;
7 Monthly active users, engaging in financial and non-financial transactions;
8 Based on RBI data as of Aug’25;
9 (specific+ standard+ additional + other contingencies) / IRAC GNPA;
10 Annualized;
11 Figures of subsidiaries are as per Indian GAAP, as used for consolidated financial statements of the Group;